Many of us know the problem that we can quickly record how many new bookings came into the system via the PMS system. However, for which period and through which channel and how high the occupancy is for this period is difficult to capture.
We have tackled this important issue here in this blog post and show you how happyhotel can help solve this problem. Do it like the top hotels and start with your cohort analysis to keep an eye on your pickup numbers.
Content:
- Why should I know how many bookings are coming in?
- What are the options for analysis and how do most hotels do it?
- This is what is behind the cohort analysis
- Cohort analysis for the hotelier
- How do top hotels analyse their numbers?
- Problem solver happyhotel – your dynamic pickup calendar for cohort analysis
- Conclusion
Why should I know how many bookings are coming in?
Every day, a hotelier looks at his bookings and his numbers. He generates his pickup report and has insight into his numbers. There’s not much that all hoteliers have in common, but whether it’s a city hotel or a spa, this KPI is really on everyone’s radar. It also lets you see which time periods are popular and busy well in advance. The comparison to the previous year also provides new insights. The analysed data can be used for further work: for example, the booking speed is very important for your turnover and thus also your profit.
What are the options for analysis and how do most hotels do it?
There are many different ways to analyse the pickup data, but most use Excel to compare the data. The biggest disadvantage here is the daily manual maintenance of the data. Line by line, the manual effort quickly becomes unwieldy and is extremely prone to errors.
Many hotels simply pull a daily report from the PMS system and try to manage their numbers through it. The problem here is often not being able to see for which period the guests who booked today will visit the hotel. The pickup report therefore involves a lot of manual effort.
The big disadvantage of an Excel list is the high maintenance effort, a poor overview and the susceptibility to errors. As soon as several employees access the same file, misunderstandings or errors can quickly occur.
Put an end to the Excel lists! Try happyhotel now for free and analyse your hotel.

This is what is behind the cohort analysis
The term “cohort analysis” currently crops up very frequently, especially in online marketing, and is a familiar term for every marketer. For example, there is a whole section in Google Analytics that deals with the cohort analysis of a website.
But what is behind it? The term “cohort” refers to a group of people who share a common demographic characteristic. This can be, for example, the same year of birth, decade of birth or time of school enrolment.
Cohort analysis can be used to measure and evaluate behavioural changes in a group with a common demographic characteristic over a period of time. Originally, this technique originated in population science. Today, it finds its use in various other scientific fields.
So-called “cohort effects” can be analysed when a cohort stands out from other cohorts due to a certain behaviour. For example, consumer groups of the same age in different years can be analysed. Each individual cohort develops specific characteristics and buying styles for its own group.
Cohort analyses have now gained immense importance. Especially in marketing, they provide data to find out more about user and buyer loyalty. It is possible to make evaluations about the buying behaviour of website visitors from a specific region. And it is possible to see whether these are new, or returning visitors. Furthermore, it is possible to take into account how often certain age or regional groups visit the website.
Based on the figures and evaluations, specific campaigns and marketing measures can be taken to encourage individual age groups to become returning visitors.
This can also be transferred to the hotel industry. Until now, it was hardly possible to collect data from guests and select them accordingly and make statements about guest behaviour.
Cohort analysis for the hotelier
But why shouldn’t hoteliers pick up on tested mechanisms from other scientific fields? The added value of such figures and analyses is immense and can redefine the entire booking behaviour.
Of course, there are other KPIs and values that matter in the hotel industry than in an online store. It does not play a significant role who the guests are or which age group they belong to, but rather the booking period. Therefore, happyhotel considers the booking time in the cohort analysis, so how long in advance is a booking made.
How do top hotels analyse their numbers?
Detailed and broad analyses are not uncommon in top hotels, but the most important key figure is probably the pickup. Since this value is necessary in many different departments, most hotels have hired extra staff (data analysts) for this purpose. This is often only the case with chain hotels, but even small hotels can learn a thing or two from this!
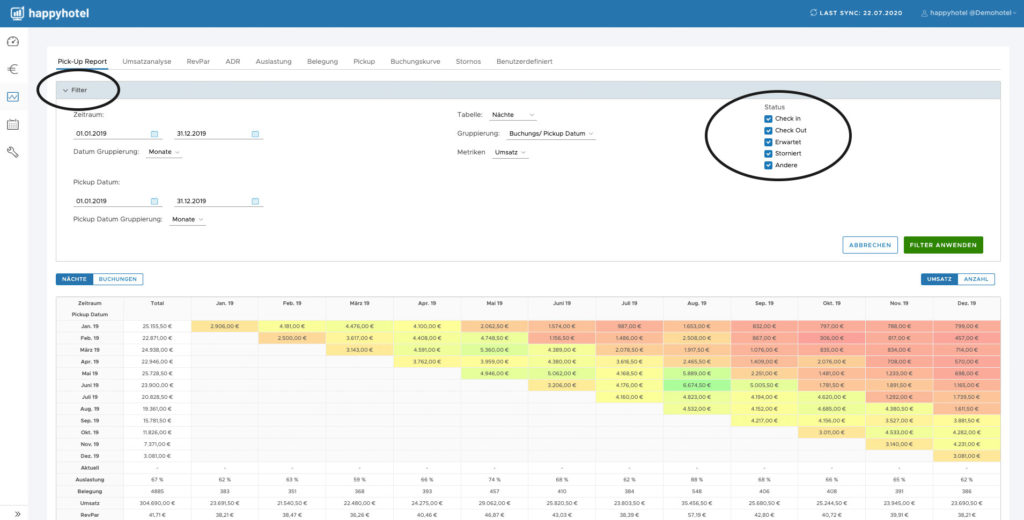
The top hotels very often use tools with which they can analyse the data. This allows them to make statements about the booking behaviour of their guests. happyhotel is a tool that helps the hotelier to analyse his data in a structured way and to get his pickup report.
Create your pickup report and start with your analysis! You can also test happyhotel with demo data.
Problem solver happyhotel – your dynamic pickup calendar for cohort analysis
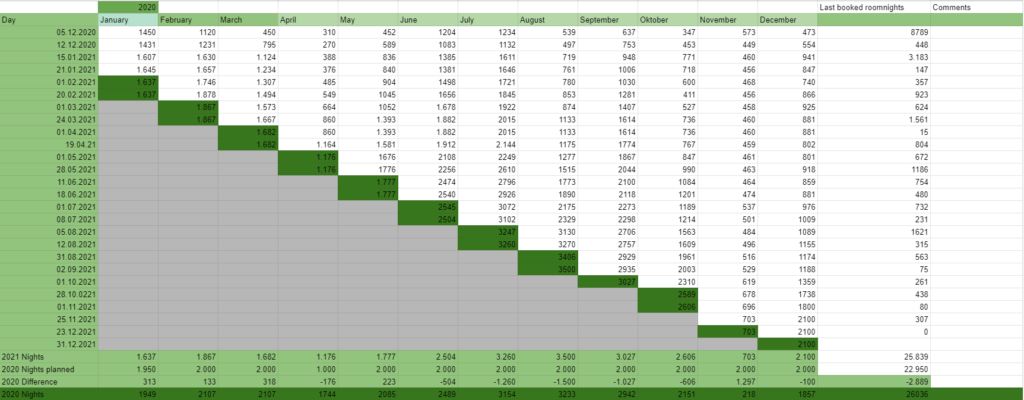
With happyhotel you always have your pickup calendar up to date. You see at a glance how many guests have booked and also directly for which period. This way you don’t miss anything anymore and you see everything with just one click. Whether you are a revenue management professional or a hotelier who wants to have an overview of the numbers, this pickup calendar will improve and speed up your work. With just a few clicks you will get your individual pickup report.
Here are a few screenshots of our favourite feature in the analysis section.
The cohort analysis table is dynamic and clickable. For example, change the perspective from the yearly overview to the monthly overview.

Using the Pickup Report, you can see when there is an increased demand for bookings for a following month. In the picture you can see the amount of bookings in March for the month of June.
In the cohort analysis you can switch your view between booking quantity (pieces), nights (quantity of nights per booking) and booking value in Euro.

You won’t miss anything here! The list is always up to date and should be your most important source in everyday business.
You want to test happyhotel yourself? Then start now for free and without obligation!
There are many more possibilities to set filters and analyse your data. For example, you can easily see the status of a booking and filter the data by it. Other filters are: Turnover, nights and booking channels, etc.
Conclusion
Based on my experience working with hotels in business and marketing, we built a spreadsheet that really saves you a lot of time. In the past, you had to laboriously maintain this by hand (Excel) and pass it to all the agencies you work with. Today, this can be passed digitally to all agencies to you pick up speed. I would recommend every hotelier to digitise bit by bit. Only then will he still be competitive and have a sustainable business model.
Pickup reports are extremely valuable for the hotel industry and can be easily adopted for rental vacation managers. I like the look of the Happy Hotel reports.