There are many key figures you should know. Not all ratios are equally meaningful. TRevPAR is one of the most important key figures in revenue management. In this article you will learn how to calculate and interpret it correctly.
What is TRevPAR? – Explanation
Calculation TRevPAR
Exemplary calculation
Application in practice
Conclusion
What is TRevPAR? – Explanation
TrevPAR stands for “Total Revenue Per Available Room” and is a derivation of the key figure “RevPAR“. With this KPI you calculate the average total revenue per available room. In contrast to RevPAR, it includes all revenues that are made up of accommodation, gastronomy and additional sales. The advantage is that it does not only focus on accommodation, but also on other revenues. It thus provides a better overview, as gastronomy, wellness, conference and banquet revenues are also considered. This is especially important for full-service hotels and holiday hotels, as these revenues are closely related to hotel occupancy.
The TrevPAR is less known than the RevPAR, but in many ways it is much more meaningful. You should definitely take it into account.
Calculation of TRevPAR
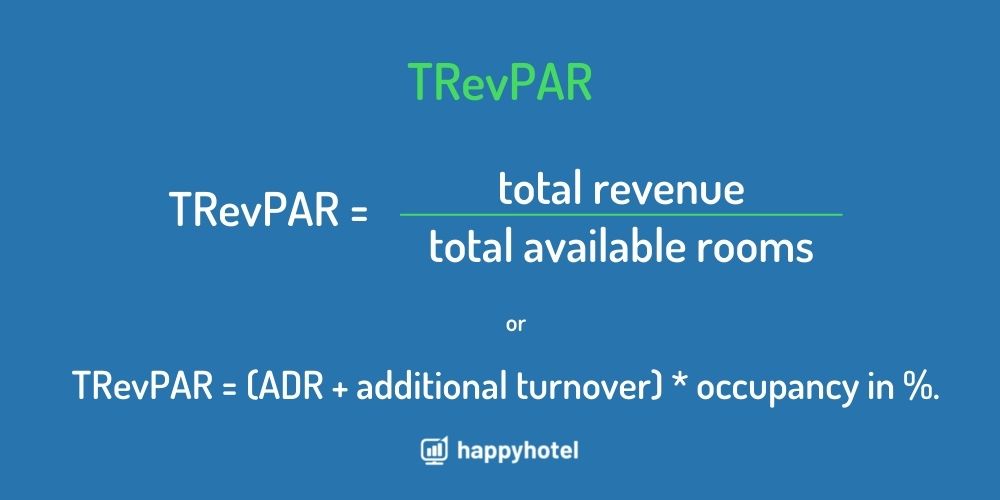
You can calculate TRevPAR as follows:
TRevPar = total revenue / total available rooms
or
TRevPAR = (ADR + additional turnover) * occupancy in %.
Exemplary calculation
In the following example our hotel has 100 rooms of which 50 are occupied. The daily rate is 70 €. In addition, there is an average turnover of 10 € per room. This results in a total turnover of 4000€:
4000€ / 100 = 40€
or like this:
80€ * 50 % = 40€
The example hotel has a TRevPar of 40€.
The KPI can be calculated for different periods, such as one day, one week, one month or one year.
Application in practice
The TRevPAR provides important information about how well the total capacities in the hotel were used. Therefore, you mainly use it to compare different guest segments with each other. This is the case in the displacement analysis. It is used to find out which requests should be accepted.
Guest segments are, for example, travellers by bus, conference guests and individual travellers. As a rule, they pay different prices, which lead to different average rates. Often, however, the additional revenues are neglected. A conference guest, for example, might stay overnight at the single room rate with the corporate rate. This rate is significantly lower than the double room rate of individual travellers.
First and foremost, it depends on how much additional turnover can be generated by the different guest segments. The conference guest pays a conference package and, if applicable, also makes turnover in the hotel bar. And the individual traveller? How likely are they to eat in the restaurant and/or book treatments? Of course, this varies from hotel to hotel. And that is exactly why TRevPAR is the optimal comparative key figure. It is crucial that the additional turnover is taken into account and not only the accommodation turnover. We have written an interesting blog post on the topic of increasing turnover in the hotel industry! Read it now.
Conclusion
As with RevPAR, this key figure combines average revenue per person and occupancy. We recommend determining and comparing the TRevPAR in addition to the RevPAR. This gives you a good overview of the profitability of your capacities.
As always, this key figure should we should analyse the key figure: It is always good to take a critical look at the factors that influence a key figure. What led to the result? Which factors had the greatest influence? Can you draw conclusions from this indicator? What opportunities for improvement can you identify from it? If you can answer all these questions and check on your TrevPAR regularly, you have a good instrument for your revenue management.